
Web Summit 2019 - Data Science Approach
Introduction
Events like Web Summit are extremely important for every Hotel and Revenue Managers. These are the days that hotels can maximize their revenue performance but also a period that every hotel can apply certain strategies that will make them more profitable when comparing the usual KPI´s with their Comp-Set. But with more than 70.000 participants coming to Web Summit, hotels are not only competing with their year-round Comp-Set. Instead they will compete with different city neighborhoods and also with short term rental properties, specially those listed OTA’s and other online platforms.
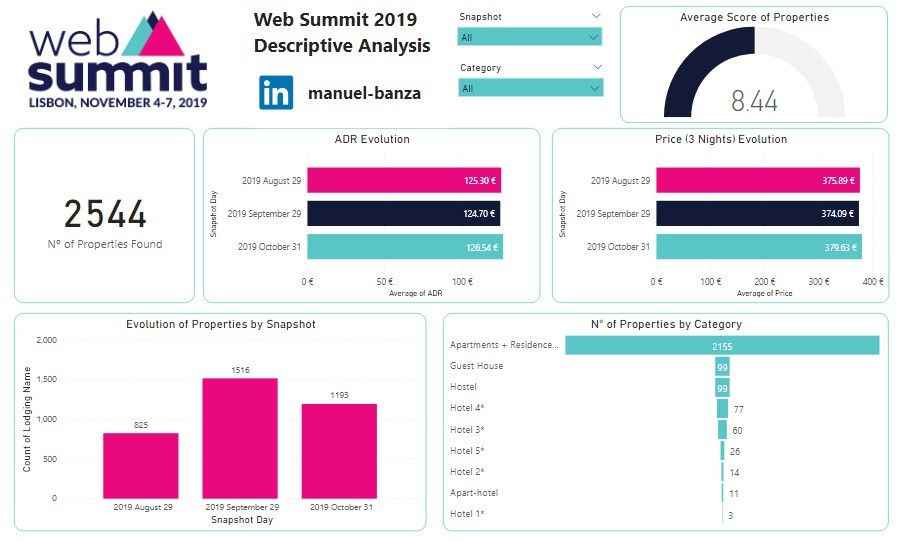
In the next few minutes I will try to take you on a journey and tell you a descriptive analysis story, describing the evolution of prices and listed properties online by neighborhoods, categories (hotels, apartments, hostels, etc.), scores, distance from city center. All the data was obtained online and using tools such as Power BI and Python. The data is regarding searches between the days of 4th of November and 7th of November (Departure date). We have 3 snapshots (days of when the information was obtained):
29th of August 29th of September 31st of October In the second part I will talk about patterns and insights that it has been possible ascertain using Python.
Pace (Evolution)
This was original posted on my LinkedIn profile and you can find the full post HERE